
Summary
Alphabet, Amazon, Meta, Microsoft, and Oracle have disclosed $1.6507 trillion of future contract payments: $821.4 billion of uncommenced leases and $829.2 billion of purchase and construction commitments.
The total measures contracts signed across many years. It is not cash already spent, a bill due today, or a balance-sheet debt balance. The companies report about $430.0 billion of interest-bearing borrowings and $1.3500 trillion of total liabilities.
The commitments equal 98.9% of the companies’ combined latest annual revenue and 62.1% of combined assets. Total liabilities equal 80.9% of annual revenue, while interest-bearing borrowings equal 25.8%. The payment periods range from less than one year to as long as 30 years.
The filings do not label every contract as AI-specific. The total is best read as a broad measure of the infrastructure, data-center capacity, energy, equipment, inventory, content, and services being secured during the AI buildout.
Evidence: The sources and method appendix contains the filing links, category definitions, calculations, and timing disclosures. We used the Finterm CLI to locate the disclosures and checked each amount against the linked primary filing.
Disclaimer: This is accounting and public-filing research, not investment advice.
The $1.65 Trillion Is a Contract Stack
The five-company total comes from two nearly equal categories.1
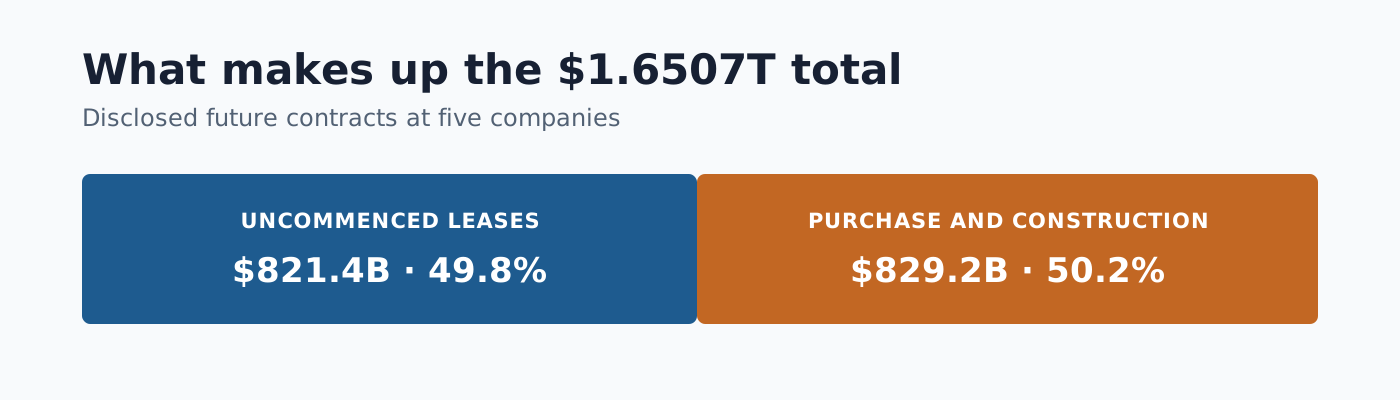
Figure 1. The $1.6507 trillion total consists of $821.4 billion of uncommenced leases and $829.2 billion of purchase and construction commitments. Company details and reporting periods appear in C1.
The first category is rent promised under leases for assets that are not yet available for use. A data center may still be in design or under construction, so the lease has been signed but has not commenced.
The second category covers contractual commitments to buy infrastructure, equipment, computing capacity, energy, inventory, content, construction, and other goods or services. The supplier still owes performance, and the company generally pays as equipment, capacity, power, or services are delivered.
The sum is nominal: a dollar due next year and a dollar due decades from now each count as one dollar. The calculation does not discount future payments, subtract the value of assets and services received, or adjust for contract amendments and cancellation provisions.
The total also mixes reporting dates. Most amounts come from March 31, 2026 filings, Oracle’s figures come from May 31, 2026, and Microsoft’s purchase and construction commitments come from June 30, 2025. The number is therefore a defined snapshot, not a same-day consolidated balance sheet.
Contracts, Liabilities, and Borrowings Answer Different Questions
Three numbers describe three different parts of the companies’ finances:
- $1.6507 trillion of future contracts measures nominal payments promised under selected lease and purchase agreements
- $1.3500 trillion of total liabilities measures all recognized obligations on the balance sheets at the stated reporting dates
- $430.0 billion of interest-bearing borrowings measures bonds, notes, loans, commercial paper, and similar funded financing
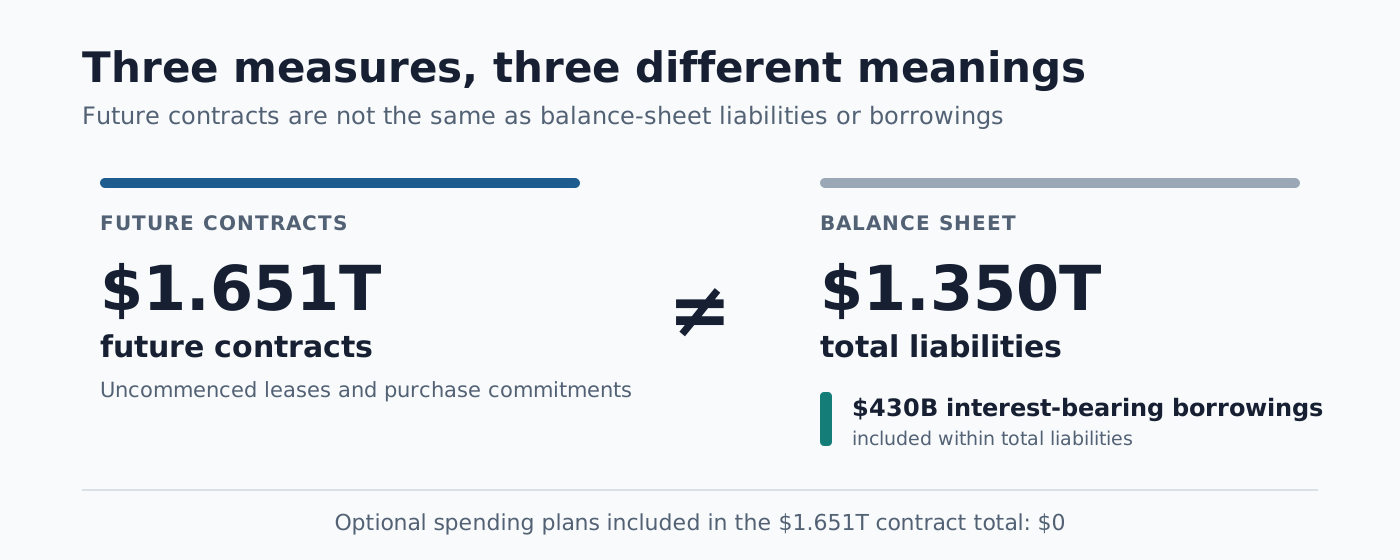
Figure 2. Future contracts are not the same measure as total liabilities or interest-bearing borrowings. Optional, noncontractual spending plans contribute zero to the $1.6507 trillion total.
Borrowings sit inside total liabilities. The rest of the $1.3500 trillion includes accounts payable, accrued compensation, deferred revenue, taxes, recognized lease liabilities, and other obligations arising in normal operations.2
The $1.6507 trillion contract total mostly sits outside that comparison. It combines payments for leases that have not commenced with purchase contracts under which the counterparties still owe assets or services. Some of those commitments will create recognized liabilities later, but not all will become debt.
How Each Category Reaches the Financial Statements
The accounting sequence changes how each dollar should be interpreted.
Interest-Bearing Borrowings
A borrowing is funded financing. The company has received cash or another financial asset and owes principal, usually with interest. The balance sheet records the obligation when the financing occurs.
Uncommenced Leases
An uncommenced lease covers an asset that the company cannot yet use. Under U.S. lease accounting, the company generally recognizes a lease liability and a right-of-use asset when the lease commences.3
The liability recorded at commencement is ordinarily the present value of unpaid lease payments, not the undiscounted nominal total disclosed before commencement. The corresponding asset also matters: the company receives the right to use the data center or other property.
Purchase and Construction Commitments
A purchase commitment is an executory contract because both parties still owe performance. The supplier must deliver equipment, energy, capacity, construction, inventory, content, or services; the buyer must pay under the contract.
Delivery may later produce property and equipment, inventory, an operating expense, accounts payable, or another recognized item. It does not automatically produce interest-bearing debt.
Optional Plans Are Excluded
The calculation does not include management aspirations or optional capital budgets. Each amount comes from a disclosed lease, non-cancelable or unconditional purchase commitment, minimum cancellation fee, take-or-pay agreement, construction commitment, or similar contract.
Contract terms still vary. Some agreements set minimum quantities, some allow cancellation after a fee, and some payments depend on delivery or project milestones. A credit analysis has to read those terms rather than treat every nominal dollar as equally fixed.
The Company Breakdown Shows Where the Scale Is Concentrated
The $1.6507 trillion total is roughly equal to one year of revenue across the five companies. Their latest annual filings report $1.6698 trillion of combined revenue and $2.6601 trillion of combined assets.4
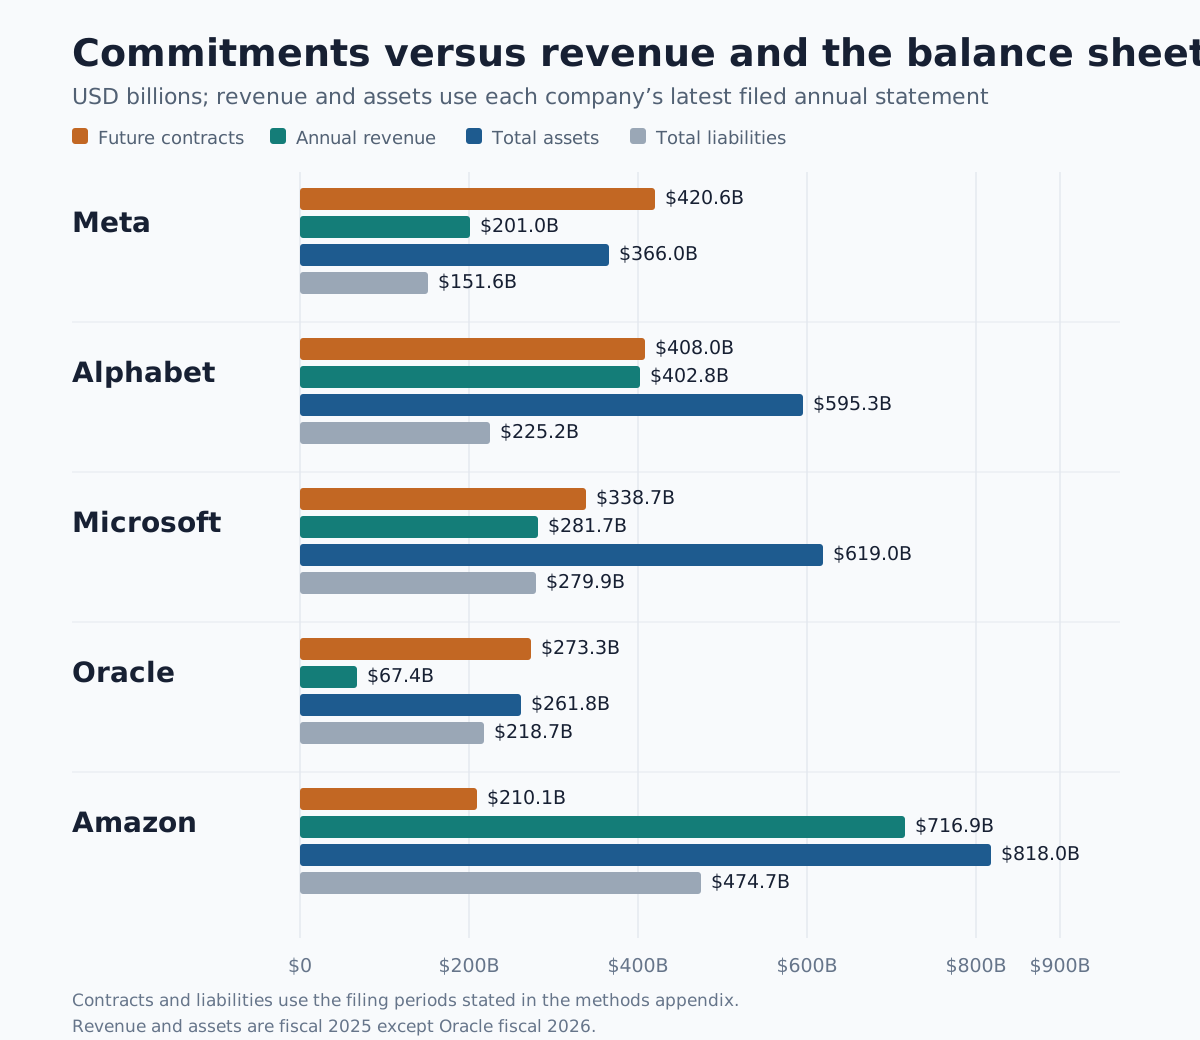
Figure 3. Oracle’s and Meta’s commitments are largest relative to their revenue and assets. Revenue and assets are fiscal 2025 figures except Oracle’s fiscal 2026 figures.
Oracle is the clearest outlier. Its $273.3 billion commitment total is more than four times annual revenue and slightly larger than total assets. Meta’s $420.6 billion also exceeds its annual revenue and assets.
Amazon sits at the other end. Its $210.1 billion of commitments equals 29.3% of annual revenue and 25.7% of assets. Alphabet’s commitment total is roughly equal to annual revenue, while Microsoft’s is about 1.2 times annual revenue.
These ratios measure scale, not solvency. Revenue is a one-year flow before expenses, assets are balance-sheet stocks, and the contracts stretch over different periods. The comparison shows which companies have committed the most relative to their current financial base; it does not say that the full amount is due now.
The Payments Extend From One Year to Three Decades
The companies do not provide one comparable annual schedule for the complete total. Some disclose annual payment buckets, while others report short-term subtotals, commencement windows, contract-term ranges, or an undated “thereafter” amount.5
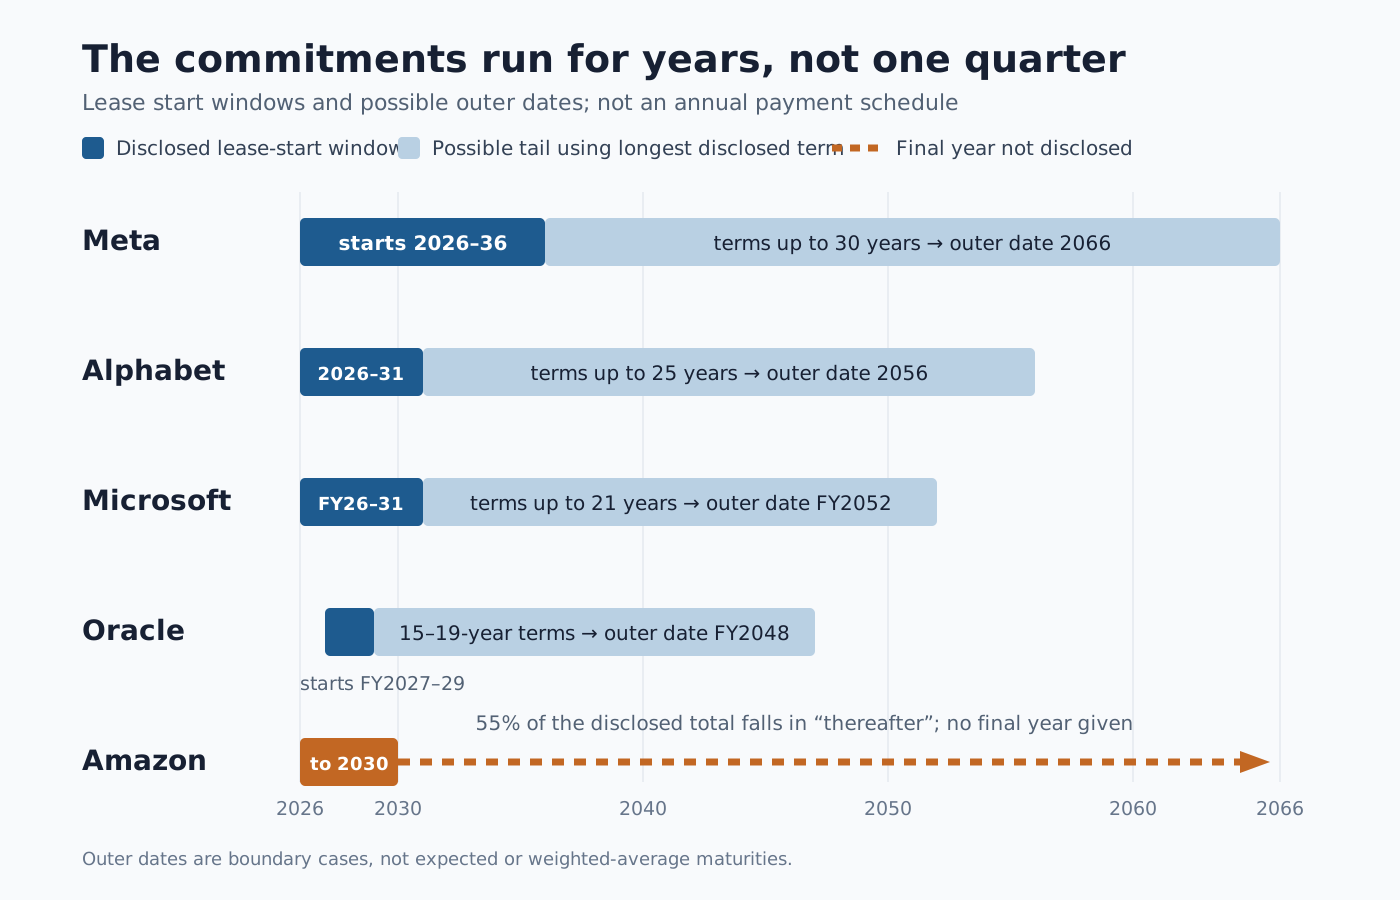
Figure 4. Uncommenced leases begin over several years and may run for as long as 30 years. Lighter bars show outer dates inferred from the latest disclosed start and longest disclosed term, not expected or weighted-average maturities.
Meta’s leases may start from 2026 through 2036 and run for as long as 30 years. A contract at both outer bounds could continue to 2066. Comparable boundary cases are approximately 2056 for Alphabet, fiscal 2052 for Microsoft, and fiscal 2048 for Oracle. Amazon reports a “thereafter” bucket without a final year.
Purchase and construction payments tend to arrive sooner. Meta reports $89.9 billion of purchase commitments due across 2026 and 2027. Alphabet classifies $138.0 billion of its $332.4 billion purchase and other contractual obligations as short-term. Microsoft’s fiscal 2025 table classifies $130.8 billion of its $142.1 billion purchase and construction commitments as short-term.
The timing mix matters. Near-term equipment and construction payments can overlap with lease payments that begin later and continue for decades. Adding them produces a useful measure of signed commitments, but not an annual cash budget.
Annualized Illustrations
The filings do not support one exact annual payment forecast for the full total. Dividing $1.6507 trillion evenly across several periods shows the arithmetic scale without claiming to reproduce the contracts.
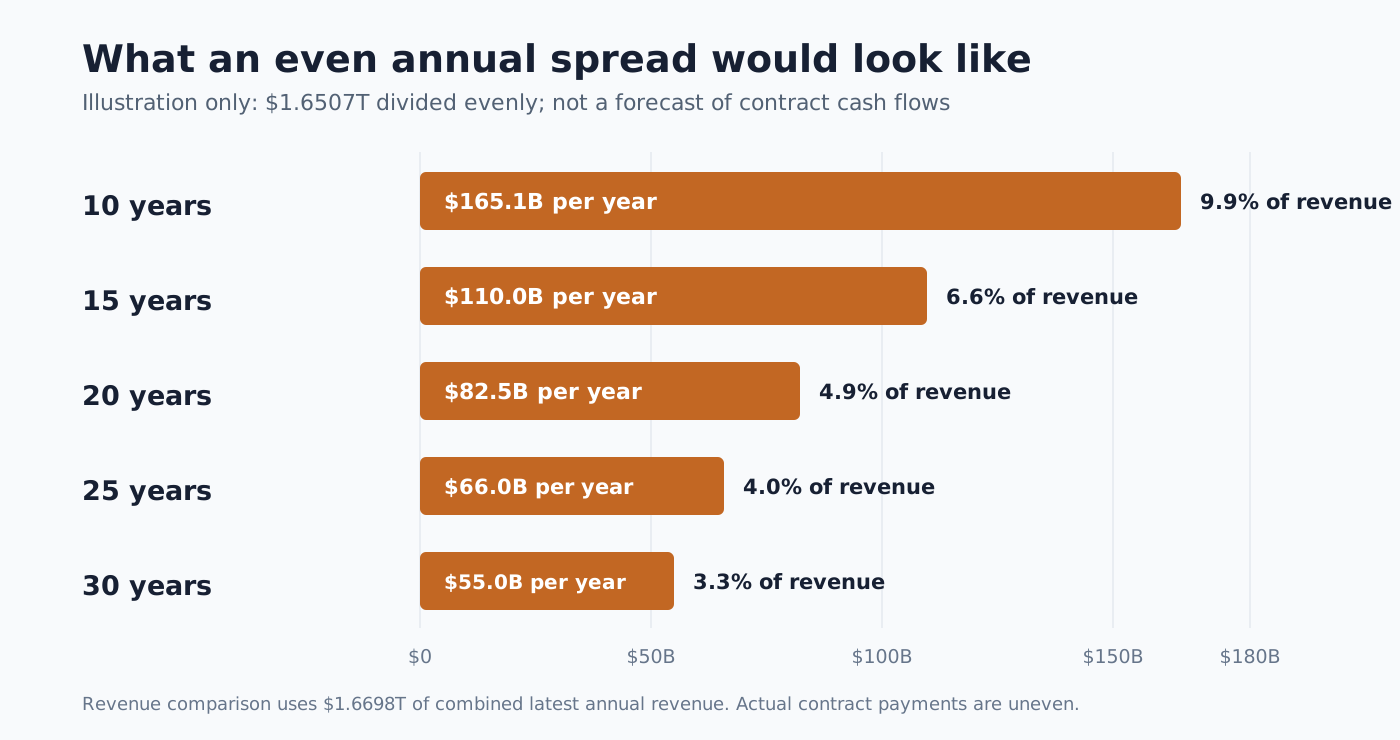
Figure 5. An even allocation produces $165.1 billion a year over 10 years and $55.0 billion a year over 30 years. These are illustrations, not forecasts of contract cash flows.
The annualized amounts range from 9.9% to 3.3% of the companies’ combined latest annual revenue. They exclude uneven payment schedules, discounting, later commencement dates, contract changes, cancellation rights, and the value of assets or services received. Actual purchase payments are more concentrated in the early years, while much of the uncommenced-lease cost begins later.
The Commitment Stack Has Grown Eightfold Since 2022
Applying the same broad categories to the companies’ fiscal 2022 annual filings produces $206.296 billion. The current snapshot is 8.0015 times that baseline.6
This is an increase in nominal future contract payments, not in funded borrowing. Longer contract terms can raise the disclosed total even when annual capacity changes by less, and the companies’ infrastructure mix and disclosure language have changed since 2022. The ratio still captures a sharp expansion in the duration and scale of capacity being secured.
The Economic Risk Depends on Contract Terms
Accounting labels do not eliminate the cash obligation. Non-cancelable leases and take-or-pay purchase agreements can reduce financial flexibility if demand, utilization, power availability, pricing, or technology lifecycles disappoint. A company may keep paying for capacity that earns less than expected, and assets placed in service may be impaired if expected cash flows fall.
Project financing can make some contracts more debt-like. An outside operator may borrow to build a data center while a technology company signs the lease, purchase agreement, guarantee, or credit backstop that makes the project financeable. The Bank for International Settlements calls this narrower mechanism “shadow borrowing.”7
The operator’s loan may remain outside the technology company’s consolidated balance sheet even though the contract supports it. The right credit questions are specific:
- Which payments are fixed, and which depend on usage or delivery?
- Can the company cancel, substitute capacity, or assume the underlying asset?
- When do payments begin, and what discount rate fits their duration?
- Does a guarantee or backstop create exposure beyond stated rent?
- What asset, service, inventory, or revenue does the company expect in return?
A nominal sum cannot answer those questions. It provides a starting point for liquidity and credit analysis.
Contracted Revenue Provides Context, Not a Direct Offset
Alphabet, Microsoft, and Amazon reported $1.4646 trillion of remaining performance obligations at March 31, 2026.8 This backlog represents contracted future revenue, including amounts already recorded as deferred revenue and amounts that will be invoiced later.
Backlog is not cash or profit. The companies must perform the contracted services, and those services carry operating and capital costs. The revenue and commitment totals also cover different counterparties, time periods, margins, and cancellation terms. They cannot be netted without matching those features.
Together, the numbers describe both sides of the buildout. The commitment stack measures future resource demand; backlog measures contracted future customer revenue.
The Number Is a Snapshot
Contract disclosures can change quickly. Alphabet’s July 22, 2026 Form 10-Q disclosed $902.0 billion across the same broad categories, up from the $408.0 billion Alphabet subtotal used in the five-company snapshot.9
Replacing only Alphabet’s figure and holding the other four companies fixed would raise the total to approximately $2.14 trillion. That calculation is a sensitivity update, not a same-date total for all five companies. It shows why the definition and filing date should always accompany a large aggregate.
What the $1.65 Trillion Tells Us
The $1.6507 trillion total is a real aggregation of disclosed contracts. It shows how much long-term infrastructure capacity five large technology companies have secured across leases, equipment, construction, energy, inventory, content, and services.
It does not measure a pure pool of AI spending. It does not equal cash already spent, current liabilities, or interest-bearing debt. It also does not reflect the present value of the payments or the assets and services the companies will receive.
The useful reading is narrower and more informative: $1.65 trillion is a multi-year contract stack whose financial risk depends on timing, discounting, cancellation rights, utilization, and the returns earned on the capacity.
Disclaimer
This article is independent research based on public filings and accounting materials. It is not investment, legal, tax, or accounting advice and does not consider any reader’s circumstances. The calculations depend on the category definitions and filing dates stated in the appendix and will change as companies file new information. Do your own research and consult a licensed professional before making financial decisions.
Appendix: Sources and Method
Evidence date: July 23, 2026
This appendix supports the calculations in “Breaking Down $1.65 Trillion of Big Tech AI Spending.” It separates reported amounts from derived totals and accounting judgments. All dollar amounts are U.S. dollars.
How the $1.65 Trillion Total Was Defined
We used the Finterm CLI to locate lease, purchase, construction, and contractual obligation disclosures. We then checked each amount against the linked Securities and Exchange Commission filing.
The calculation includes two categories:
- uncommenced lease payments
- purchase, construction, and other contractual commitments
It excludes recognized lease liabilities to avoid counting commenced leases twice. It also excludes management guidance and optional capital budgets. The total is nominal and does not discount future payments. Amounts retain the precision disclosed by each company.
The companies do not share a fiscal year-end or one reporting format. Most current amounts come from March 31, 2026; Oracle’s come from May 31, 2026. Microsoft’s purchase and construction commitments come from June 30, 2025 because its March 2026 filing updated uncommenced leases without publishing a replacement total for those categories.
The total is a broad infrastructure-commitment measure, not a pure measure of AI spending. The underlying disclosures include data centers and computing capacity, but also energy, equipment, inventory, construction, content, and other goods or services.
C1. Building the $1.65 Trillion Snapshot
Amounts are billions.
| Company | Filing period used | Uncommenced leases | Purchase and construction commitments | Total |
|---|---|---|---|---|
| Meta | March 31, 2026 | $182.880 | $237.670 | $420.550 |
| Alphabet | March 31, 2026 | $75.600 | $332.400 | $408.000 |
| Microsoft | March 31, 2026 leases; June 30, 2025 commitments | $196.600 | $142.102 | $338.702 |
| Oracle | May 31, 2026 | $260.000 | $13.309 | $273.309 |
| Amazon | March 31, 2026 | $106.347 | $103.768 | $210.115 |
| Total | $821.427 | $829.249 | $1,650.676 |
Microsoft’s $142.102 billion subtotal consists of $32.149 billion of construction commitments and $109.953 billion of purchase commitments.
Primary Sources
- Meta Q1 2026 Form 10-Q
- Alphabet Q1 2026 Form 10-Q
- Microsoft March 2026 Form 10-Q
- Microsoft FY2025 Form 10-K
- Oracle FY2026 Form 10-K
- Amazon Q1 2026 Form 10-Q
Limits of the Total
The calculation mixes economic categories, reporting dates, and contract lengths. A dollar due next year and a dollar due decades from now receive equal weight. The total establishes the nominal scale of selected future payments, not the present value of a financing instrument.
C2. Recognized Borrowings and Total Liabilities
Amounts are billions. Borrowings use the carrying value of reported interest-bearing debt and exclude lease liabilities.
| Company | Recognized borrowings | Total liabilities |
|---|---|---|
| Meta | $58.748 | $151.569 |
| Alphabet | $79.499 | $225.173 |
| Microsoft | $40.262 | $279.861 |
| Oracle | $129.541 | $218.703 |
| Amazon | $121.906 | $474.716 |
| Total | $429.956 | $1,350.022 |
The total-liability amounts come from the same current filings listed under C1. Total liabilities include borrowings and also accounts payable, accrued expenses, deferred revenue, taxes, recognized lease liabilities, and other operating obligations.
The contract and liability totals use different measurement bases. The $1.650676 trillion contract total is an undiscounted stream of payments over many years. The $1.350022 trillion liability total is measured at specific balance-sheet dates under the recognition rules for each liability class.
C3. Change Since Fiscal 2022
Applying the same categories to the companies’ fiscal 2022 annual filings gives:
| Calculation | Amount |
|---|---|
| Current commitment snapshot | $1,650.676 billion |
| Comparable fiscal 2022 commitments | $206.296 billion |
| Current divided by fiscal 2022 | 8.0015 times |
The baseline excludes recognized lease liabilities and balance-sheet debt, matching the current category definition.
Fiscal 2022 Source Filings
- Meta FY2022 Form 10-K
- Alphabet FY2022 Form 10-K
- Microsoft FY2022 Form 10-K
- Oracle FY2022 Form 10-K
- Amazon FY2022 Form 10-K
Limits of the Comparison
The ratio is sensitive to contract duration and disclosure scope. A company that replaces a shorter contract with a longer one can report a larger undiscounted commitment even if annual capacity changes by less. The companies also changed their infrastructure mix and disclosure language between 2022 and 2026. The ratio measures change in the defined contract stack, not change in funded borrowing.
C4. Accounting Treatment
Borrowings
Debt generally reflects funded financing. The borrower receives cash or another financial asset and recognizes an obligation to repay principal, usually with interest.
Leases
The Financial Accounting Standards Board’s lease standard requires a lessee to recognize a lease liability and right-of-use asset at the commencement date. The lease liability is based on the present value of lease payments not yet paid. An uncommenced lease has not reached that recognition point because the underlying asset is not yet available for use.
When the lease commences, the accounting entry ordinarily includes:
- a discounted lease liability
- a right-of-use asset, adjusted for items such as prepayments and incentives
The filing’s nominal stream of future rent therefore does not become an equal amount of debt principal on commencement.
Purchase Commitments
Purchase commitments are executory contracts when both sides still owe performance. The supplier owes equipment, power, capacity, construction, inventory, content, or services. The customer owes payment as the contract is performed.
The SEC’s contractual-obligations rules have treated purchase obligations as a distinct disclosure category and explained that the related liability is generally recognized when the counterparty performs. Delivery can produce property and equipment, inventory, expense, accounts payable, or another recognized item. It does not mechanically produce interest-bearing debt.
Authoritative Sources
C5. Contract and Project-Finance Risk
Some commitments can be economically debt-like and material to credit risk without being accounting debt. The exposure depends on duration, cancellation rights, utilization, pricing, asset substitution, counterparty strength, guarantees, and what the company receives in return.
Project financing adds another layer. An infrastructure operator can borrow against a long-term lease, offtake agreement, guarantee, or credit backstop from a technology company. The operator’s debt may remain outside the customer’s consolidated balance sheet even when the customer’s contract is the economic support for the financing.
The Bank for International Settlements uses “shadow borrowing” for this narrower structure in its analysis of AI infrastructure finance. Moody’s treats uncommenced lease commitments as relevant to credit analysis but applies credit adjustments rather than equating nominal future rent with funded debt.
Sources
“Debt-like” is an analytical description, not an accounting category. A credit model should discount the fixed payments, examine termination and backstop terms, and recognize the assets or services received in return.
C6. Contracted Revenue Backlog
Alphabet, Microsoft, and Amazon reported the following remaining performance obligations at March 31, 2026. Amounts are billions.
| Company | Remaining performance obligations |
|---|---|
| Alphabet | $467.6 |
| Microsoft | $633.0 |
| Amazon | $364.0 |
| Total | $1,464.6 |
Primary Sources
Remaining performance obligations are contracted future revenue. They include some amounts already recorded as deferred revenue and some to be invoiced later. Recognition depends on performance, contract terms, and customer usage. The totals cover different weighted durations and are gross of the costs required to deliver the services.
The backlog cannot be netted mechanically against purchase and lease commitments. A coverage analysis would need to match counterparties, timing, margins, cancellation rights, and performance conditions.
C7. Alphabet Second-Quarter Update
Alphabet’s July 22, 2026 Form 10-Q disclosed:
| Category | Amount |
|---|---|
| Purchase and other contractual obligations | $811.0 billion |
| Short-term payments for leases not yet commenced | $5.8 billion |
| Long-term payments for leases not yet commenced | $85.2 billion |
| Alphabet Q2 subtotal | $902.0 billion |
Replacing Alphabet’s $408.0 billion first-quarter subtotal in C1 with $902.0 billion gives:
$1,650.676B - $408.0B + $902.0B = $2,144.676B
The updated five-company sensitivity is approximately $2.14 trillion if every other company is held fixed. It is not a same-date total for all five companies.
Primary Source
C8. Scale Relative to Revenue and Assets
Amounts are billions. Revenue and assets come from fiscal 2025 annual filings except Oracle, whose fiscal 2026 annual filing was available. Total liabilities use the latest filing periods in C1.
| Company | Contracts | Annual revenue | Total assets | Latest total liabilities |
|---|---|---|---|---|
| Meta | $420.550 | $200.966 | $366.021 | $151.569 |
| Alphabet | $408.000 | $402.836 | $595.281 | $225.173 |
| Microsoft | $338.702 | $281.724 | $619.003 | $279.861 |
| Oracle | $273.309 | $67.357 | $261.759 | $218.703 |
| Amazon | $210.115 | $716.924 | $818.042 | $474.716 |
| Total | $1,650.676 | $1,669.807 | $2,660.106 | $1,350.022 |
The ratio calculations are:
- contracts divided by annual revenue: 98.9%
- contracts divided by total assets: 62.1%
- contracts divided by latest total liabilities: 122.3%
- latest total liabilities divided by annual revenue: 80.9%
- recognized borrowings divided by annual revenue: 25.8%
These ratios mix a multi-year undiscounted payment stream, a one-year revenue flow, and balance-sheet stocks. They answer a scale question only. They do not measure when cash is due, the margin on associated revenue, the value of assets or services received, or the companies’ ability to refinance.
Primary Sources
- Meta FY2025 Form 10-K
- Alphabet FY2025 Form 10-K
- Microsoft FY2025 Form 10-K
- Oracle FY2026 Form 10-K
- Amazon FY2025 Form 10-K
C9. Timing and Annualized Payment Scenarios
The filings show payment periods ranging from less than one year to approximately 30 years, but they do not provide one comparable annual schedule for the complete $1.650676 trillion.
| Company | Uncommenced-lease timing | Other commitment timing |
|---|---|---|
| Meta | $182.880 billion begins from the remainder of 2026 through 2036; terms range from more than one year to 30 years. | Of $237.670 billion, $42.250 billion is due in 2026 and $47.650 billion in 2027. The remaining $147.770 billion is due later. |
| Alphabet | $75.600 billion begins during 2026–2031; terms range from 1–25 years. | Of $332.400 billion, $138.000 billion is short-term and $194.400 billion is long-term. |
| Microsoft | $196.600 billion begins during fiscal 2026–2031; terms range from 1–21 years. | The fiscal 2025 commitment table classifies $130.799 billion as short-term and $11.303 billion as long-term. |
| Oracle | $260.000 billion begins during fiscal 2027–2029; terms generally range from 15–19 years. | $1.841 billion is due in fiscal 2027, $1.034 billion in 2028, $1.053 billion in 2029, $0.952 billion in 2030, $0.896 billion in 2031, and $7.533 billion thereafter. |
| Amazon | The filing does not state a final year for $106.347 billion of uncommenced leases. | Combined uncommenced-lease and purchase payments are $24.278 billion in the remainder of 2026, $25.442 billion in 2027, $15.697 billion in 2028, $14.623 billion in 2029, $14.622 billion in 2030, and $115.453 billion thereafter. |
The possible outer dates for Meta, Alphabet, Microsoft, and Oracle are derived by adding the longest stated term to the latest stated commencement year. They are boundary cases, not expected or weighted-average maturity dates. Amazon reports a “thereafter” bucket without a final year, so the same calculation is not possible.
Annualized Scenario Method
The annualized scenarios use:
annualized nominal payments = $1,650.676 billion ÷ assumed payment years
The revenue comparison uses $1,669.807 billion of combined annual revenue from C8.
| Assumed payment years | Annualized nominal payments | Annualized payments divided by revenue |
|---|---|---|
| 10 | $165.068 billion | 9.9% |
| 15 | $110.045 billion | 6.6% |
| 20 | $82.534 billion | 4.9% |
| 25 | $66.027 billion | 4.0% |
| 30 | $55.023 billion | 3.3% |
These equal-payment illustrations are not forecasts or present-value estimates. The filings show that actual cash payments are uneven. Purchase and construction commitments include substantial near-term amounts, while many uncommenced leases start later. The calculation also excludes contract amendments, cancellation provisions, discount rates, interest components, and the assets and services obtained.
Primary Sources
- Meta Q1 2026 Form 10-Q
- Alphabet Q1 2026 Form 10-Q
- Microsoft March 2026 Form 10-Q
- Microsoft FY2025 Form 10-K
- Oracle FY2026 Form 10-K
- Amazon Q1 2026 Form 10-Q
Company figures, source dates, category mapping, and primary filing links: C1. ↑
Recognized borrowings, total liabilities, and calculation method: C2. ↑
Recognition rules for borrowings, leases, and executory contracts: C4. ↑
Latest annual revenue, assets, liabilities, and ratio calculations: C8. ↑
Company timing disclosures and annualized scenario calculations: C9. ↑
Fiscal 2022 sources, category controls, and ratio calculation: C3. ↑
Credit-analysis treatment, project-finance structures, and the limits of nominal aggregation: C5. ↑
Company-level remaining performance obligations and interpretation: C6. ↑
Alphabet’s July 22 filing and the updated five-company sensitivity: C7. ↑